Maps have been used for centuries for navigation and exploration. The invention of the printing press in the 15th century allowed for the mass production of maps, which made them more widely available. Today, geographical charts are used for a variety of purposes, from business to academia to recreational activities. A geographical chart is a map that shows the location and intensity of certain data features on the earth’s surface. Keep reading to learn more about geographical charts and how to use them.
Geographic Charts
So, what is a geographical chart? Geographical charts are beneficial for data that varies by state, country, or region. By using different colors, a geographical chart can show which areas have a high concentration of the data and which areas have a low concentration. This makes it easy for the reader to see patterns and trends. Geographical charts are also called geo charts or map charts and show various boundaries and borders while highlighting location data in specific areas.
A geographical chart is a data visualization map that displays geographic features and data. The map can be used to locate specific places, identify patterns, or track changes over time. There are many different types of geographical charts, including but not limited to political maps, physical maps, climate maps, and population density maps.
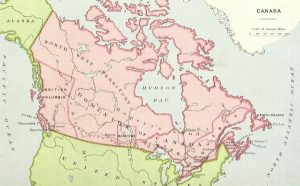
Political maps show the borders of countries and their capitals. Physical maps display the natural features of an area, such as mountains, rivers, and forests. Climate maps show the average temperatures and precipitation levels in different areas. Population density maps show how densely populated an area is by illustrating how many people live in each square kilometer.
Types of Geographical Charts
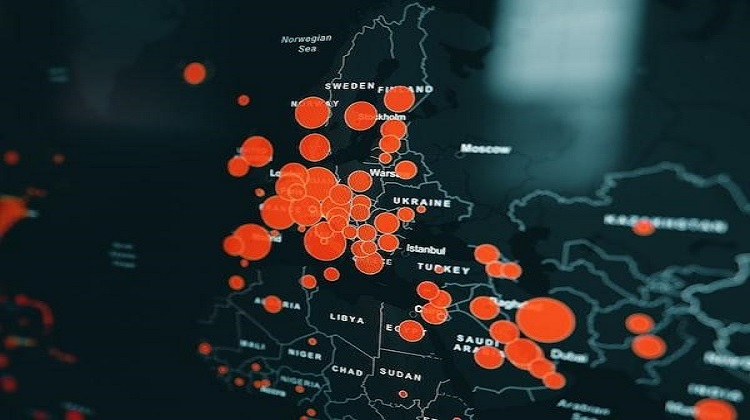
Geographical charts are classified into various types based on their specific purpose or use. Regional geographical charts are one of the most common types of charts. They are used to display data from different regions on the map. Marker geographical charts use colored spaces to represent data. This data visualization is similar to a bubble chart with larger or more densely colored markers representing a higher quantity. On some geographical charts, a heat map of varying intensity can be used to represent data. This is useful for showing data that has some degree of variation that can’t be demonstrated by a color gradient alone.
Business benefits of geographical charts.
Aside from academic settings, the business world also has a lot to gain from geographical charts. For example, real estate businesses can use them to identify areas that are growing or declining in popularity. They can also be used to identify areas that are prime for development. Retail businesses can use geographical charts to determine the best locations for new stores. Car companies can use them to identify areas that are experiencing a lot of growth, so they can plan where to open new dealerships.
Geographical charts are also important for marketing purposes. Marketers can use them to identify trends in consumer behavior. They can also use them to identify new target markets.
In addition to businesses, governments and other organizations can also benefit from geographical charts. For example, a government can use them to identify areas that are in need of economic development. They can also use them to identify areas that are prone to natural disasters. Organizations can use them to identify areas that are in need of aid. Geographical charts are also popular among recreational users. For example, hikers can use them to find the best trails. Bird watchers can use them to find the best places to see birds. Fishermen can use them to find the best fishing spots.
Geographical charts are important data analysis tools that can be used in a variety of applications to help understand and analyze the spatial relationships between phenomena and data in various locations. They can identify patterns and trends, as well as understand the effects of geographical features on activity and behavior. It can help highlight the data trends and patterns of a place and how it has changed over time.